I heard from a colleague about this paper recently and thought it was really interesting and relevant to some of the work I’m doing. I figure I’ll aim to do a paper summary here every so often to mix it up from conference presentations. So let’s dive right in.
Soares, L.B., FitzGerald, N., Ling, J. and Kwiatkowski, T., 2019. Matching the Blanks: Distributional Similarity for Relation Learning. arXiv preprint arXiv:1906.03158.
One-liner: The authors used BERT in a supervised and unsupervised way to identify the relation between entities, outperforming the state of the art in this task even without using data labelled with relationship type.
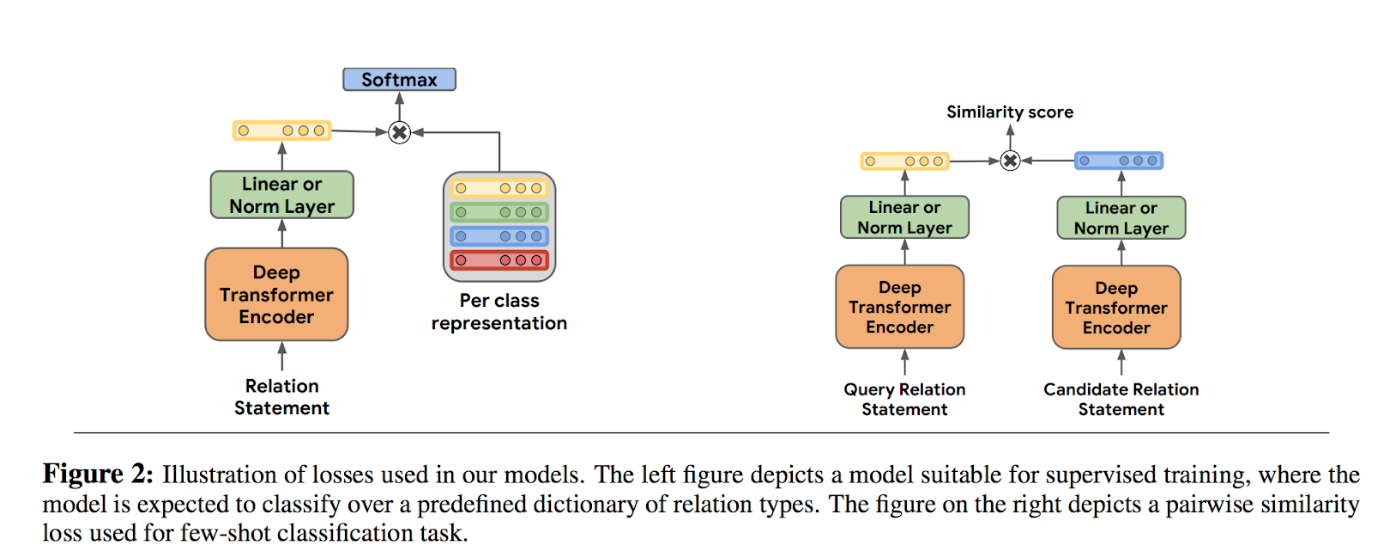
Relation learning is essentially trying to extract the relationship between entities in text. A lot of work here tends to rely on predefined mappings or on large knowledge network datasets. The authors here investigated methods to extract the relationship without these dependencies. There are two parts to this paper as I read it, a “supervised approach” and an “unsupervised approach”. An overview visualization is below:

The first part of the paper focuses on what I’m calling a “supervised approach”, as it uses a labelled set of relationship types (e.g. capital cities, authorship). In this approach, Soares et al use the deep transformer architecture BERT to create fixed-length representations of relationship information. They use three different methods for creating a training dataset along with three methods for extracting the fixed-length representation
Dataset creation
- Standard input: Data as-is, meaning just the statement about the entities and their relation. Some formatting is performed to fit with BERT’s expected input
- Positional embeddings: An additional element is added to the data to indicate which word pieces indicate which entity (i.e. either entity 1 or entity 2)
- Entity marker tokens: Data is augmented with special “start” and “end” tags at the beginning and end of each entity
Fixed-length representation
- [CLS] token: For BERT inputs, statements begin with a special “[CLS]” token. This token can be used as a sort of representation of the entire statement. By extracting the hidden state of the BERT model at this token, the authors get their representation.
- Mention pooling: The representation is a concatenation of the maxpooled hidden state of each of the entities.
- Entity start state: The representation is the concatenation of the hidden state of the entity “start” token. This method can only be used with dataset 3 above.
This adds up to six different formulations of the training data and representations. For each, a fully-connected network was trained to predict the relationship type based on the representation. The best performing formulation was the entity start state (representation 3) with entity start tokens (dataset 3), which outperformed the state of the art (SOA) on several tasks.
The paper then moves into what I’m calling the “unsupervised task”. This is where the “matching the blanks” title comes into play. The idea here is that the BERT model outputs a representation that likely contains some information about the relationship between entities. What is needed is some kind of objective function that extracts this information in a way that similar relationships will have a similar “relationship vector” and dissimilar ones will have less similar vectors.
The dataset, in this case, consists of a set of paired entities and the relation statement between them (i.e. the text of the statement itself and the start identifiers for each entity). Some smart sampling is used to ensure no pair of entities is particularly over-represented and that there are sufficient examples for any given entity that relationships between that entity and others can be extracted.
The blanks are used, as I understand it, because the objective function the authors designed could potentially just learn the function that created the underlying dataset. Basically, the function could be perfectly minimized by learning which relation statements are exactly the same and which are not the same. But this doesn’t mean the model learns anything about relationships. So the authors replace the entity tokens with a “blank” token with some probability. This thereby breaks the link between specific entities and their relation statement and forces the model to use contextual information to learn whether a relationship is the same or different.
I know that explanation is a bit convoluted. I think some examination of the function would help. Personally, I struggled a bit to understand exactly why the blanks came in here. If people have some better way to understand this, get in touch!
To compare the result from the model with the SOA and the supervised model, the authors basically use the distance between relationship vectors, ranking the candidate relationship vectors by their closeness to the target relationship vector. For example, in the FewRel dataset, there are examplar statements of the “capital” relationship like “Trenton is the capital of New Jersey”. The relationship vector for this relationship should be closer to other “capital” relationships versus non-capital relationships. I’m a bit confused how they choose a distance cut-off here, but likely a closer reading would help me understand.
The unsupervised approach outperforms the SOA as well as the supervised model in a pretty astonishing way. It also appears to outperform human labelling in some tasks.
This is a pretty exciting result and a fascinating method. It’s something I definitely want to try out for myself. Maybe another blog post? We’ll see!
Let me know if you have any questions or some better way of explaining the use of the “blanks” in the statements or the comparison with the SOA. Or anything else :)
 Ben
Ben